The Z80 debugger is a source and/or assembly level graphical debugger for Windows.
There is a built-in Z80 emulator with 64K RAM or it can be connected to a hardware ICE.
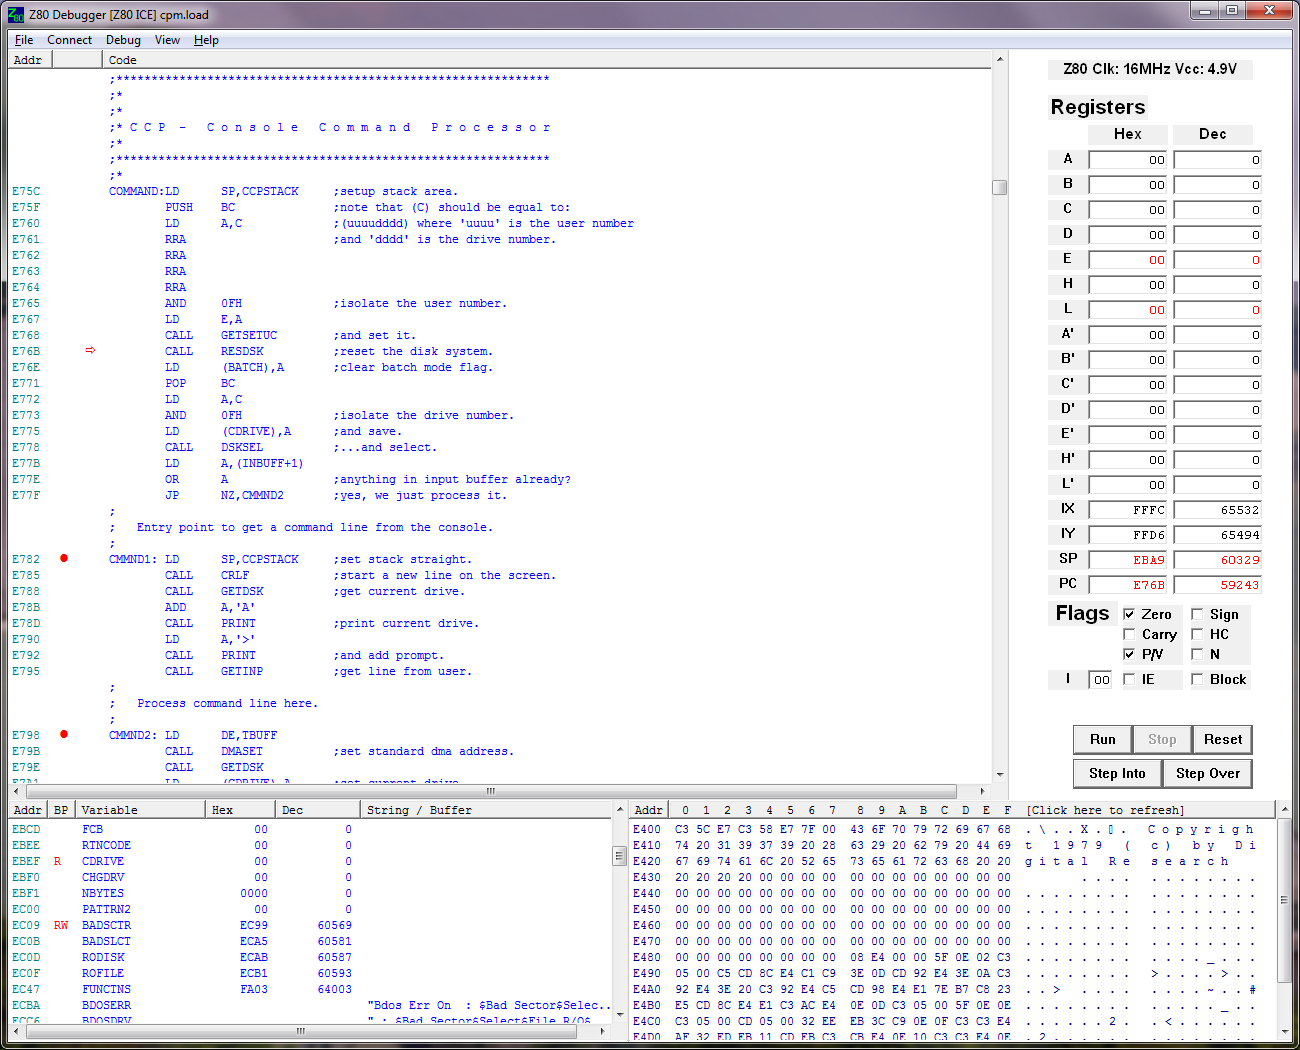
The debugger is split into 4 areas: The largest area (top left) is the code view, top right is the register view, bottom left is the variable view and bottom right is the memory view.
The image above shows the CP/M source code being ported to a new Z80 platform. It has been assembled with SJASM.
The first time you run the debugger, you need to select Z80 Emulation or ICE Port... from the Connect menu. On subsequent runs, the debugger remembers the connection type and port.
To load a binary image, select File->Load Binary, pick a file and a load address. Binary files can be included in .load files (see below) to load a number of blocks of code/data to different addresses without picking the file and load address each time.
To load source code, select File->Load Source, pick a file type from the filter box and a file to load. At present, the only supported source code formats are SDCC (C compiler), SJASM and UZ80AS assemblers.
To load an SDCC project, build it with the --debug switch and load the .lk file. The debugger will load all the .lst files containing the C code and generated assembler lines, load the .map file and resolve the symbols. Some of the superfluous information is stripped out of the .lst files and they are all glued together into one giant listing in the address order and displayed in the code view. The binary is loaded on to the Z80 target.
To load an SJASM or UZ80AS project, you need to write a text file with a .load extension, which is just a list of files and load adresses in hex - each line should be something like "main.lst 0x0100" then pick the .load file and the files will be loaded into the Z80 memory.
The last 4 loaded files are shown on the File menu for easy access.
If you have loaded source code, F12 will switch between a disassembled memory view and a source code view. If you have loaded binary, only the disassembly view is available. The disassembly view reads the memory and shows the opcodes and decoded mnemonics, whereas the source code view shows the file contents which may or may not be the same as the current memory contents (could be ROM, could have been remapped, could have been overwritten etc).
There are 3 types of breakpoints you can set. There is no limit to the number of breakpoints (even on hardware)...
Code execution breakpoints Double clicking on the required line in the code view toggles a breakpoint on/off, a red circle indicates a line with a breakpoint set. A code breakpoint will cause the Z80 to stop before it executes the line with the breakpoint.
Data read breakpoints Double clicking on the required line in the variable view opens a dialog box where the breakpoints can be set, a red 'R' in the BP column indicates an address with a data read breakpoint set. A data read breakpoint will stop the Z80 on the instruction after the memory is read. If the breakpoint was on the stack and a RET caused the read, the PC will likely be on an instruction following a CALL in a completely different part of code.
Data write breakpoints Double clicking on the required line in the variable view opens a dialog box where the breakpoints can be set, a red 'W' in the BP column indicates an address with a data write breakpoint set. A data write breakpoint will stop the Z80 on the instruction after the memory is written which means the variable value will have changed. If the breakpoint was on the stack and a CALL caused the write, the PC will be at the called address.
If you want more than one type of breakpoint on a single address or you want to put a breakpoint on an unreferenced address or unlisted variable, you can use the Edit Breakpoint... dialog from the Debug menu. Note that double clicking in the variable view simply invokes the same menu with the address field filled in and only one byte is breakpointed. If you are debugging problems such as variable corruption, it may be necessary to put data breakpoints on all the bytes in a variable. If you want to trap NULL pointer accesses, put data read/write breakpoints on address zero or a range of addresses near zero to catch NULL struct element accesses.
When running in emulation mode, data read/write breakpoints always give a specific message when the breakpoint triggers, stating which address was read/written but the hardware ICE cannot tell which data breakpoint has triggered, so if there are multiple data breakpoints, the dialog will only give as much information as it can.
With a hardware ICE, the Z80 runs at the full system clock speed. The clock frequency is measured by the ICE and displayed at the top of the register view. The ICE doesn't stop the clock and refresh signals are continuously generated to keep DRAM contents (if the system contains DRAM) and circuits such as video display are also kept alive. When a Z80 instruction accesses the system, it does so at full speed. With the emulation, the code is run as fast as your PC can run it.
The Z80 code can be stepped through using the buttons in the register view or by using F keys (see Debug menu for a list). Register values go red if they have changed after each step and can be freely edited when debugging. The PC can be set to any address and execution resumed from there. Right clicking a line will run up to that line. When the CPU is running, the code view is greyed out - if you right click and the code view goes grey, it means the Z80 hasn't reached the line you clicked on and you'll have to press Stop.
When you step code, the debugger first reads a few bytes of memory at the PC address, decodes the instruction and works out the next PC address after the instruction has been executed. Most instructions don't jump anywhere so the next instruction is a few bytes away but some instructions are more complex e.g. JR Z, -10 where the debugger needs to work out whether the jump will happen and what address it will jump to by reading the registers and flags. Once the next address is known, the debugger puts a breakpoint on that address and runs from the current address at full CPU speed. In reality, the process is complicated by the need to manage the user breakpoints for example to run from a line with a breakpoint and to deal with differences between step in, over, to and so on.
As much as possible, the debugger is designed to give you an intuitive experience similar to modern devices with built-in debug hardware such as x86 or ARM systems and debuggers such as Visual Studio. However, it is important to have an idea what is going on under the hood so you understand what could be happening when you get surprising results. Here are a few things to look out for...
If you step over a CALL instruction, the whole function will be run and, if there are breakpoints within the function, the debugger will stop. If interrupts are enabled, an interrupt can be serviced at the same time. This means that stepping some code that is waiting for an event (like a character in a UART or a timer to expire) will step intuitively and not just hang waiting for the event. If you are running an RTOS and it switches tasks, you can stop somewhere else with a breakpoint. In all these cases, the original step over breakpoint that was put on by the debugger will be removed when the Z80 stops so you cannot get back to the line you stepped over by running again.
If you are inside a loop at a breakpoint and run from there, the Z80 will execute one loop and stop again at the breakpoint. This is accomplished by removing the breakpoint and stepping instructions until one is found with no breakpoint, then putting the breakpoint(s) back and running. As a result, if you put breakpoints on all the lines in a loop, the debugger cannot execute a run request. In a similar way, the debugger cannot step or run a jump to self instruction as the breakpoint address is the same as the current address. The HALT instruction is a special case as it is interruptable so a step can be executed if an interrupt is serviced.
Many simpler ICEs for legacy devices step code by controlling the Z80 clock. This means that a step will enter an interrupt if one is pending. This debugger simply executes the whole ISR and returns, then stops at the breakpoint on the next instruction. For this reason, we have added control of the interrupts to give you a choice whether to service interrupts while stepping code.
The IE check box tells you whether the Z80 interrupts are enabled and the Block checkbox can be set to block interrupts when connected to hardware with the ICE. The difference between them is that the Z80 code can control IE whereas Block is a hardware feature of the ICE. If your system has a timer or similar interrupt source which is running from the Z80 clock or its own clock source, then every time you step the code, the interrupt will go off and be serviced during the step. Block prevents this from happening. The Z80 emulator has no interrupt connection so Block does nothing in emulation mode.
The memory view shows 256 bytes starting at the given address. To change the address, click on the 'Addr' heading. Clicking on the heading marked [Click here to refresh] will re-read the memory contents. At present there is no support for editing the memory contents.
The variable view shows variables that the .lst file parser has discovered in source files. At present it simply looks for DB, DW etc. directives in the assembler listing. There is no support for dynamic variable changes in C functions as the stack frame changes, so SDCC projects only contain global variables. Simple variables up to 4 bytes are refreshed on every code step but variable that seem to be buffers or strings are refreshed when [Click here to refresh] is clicked in the variable view. At present there is no support for editing the variable values.
Be aware that you should avoid defining a variable name for a read-sensitive peripheral register. For example, if you say RXD: DB 0 for your UART's receive data register, the debugger will add it to the variable list and read it after every step so you will lose those characters. This can be avoided by using EQU or (base + offset) constructs.